Feature: On the map
Feature: On the map
From North Jersey’s scenic Highlands to the Jersey Cape’s shoreline, 9.4 million people call the Garden State home—more per square mile than all of populous India. Growing employment, population and the retail revolution are just a few drivers of record land development in New Jersey. What’s happening in your backyard and what can you do about it? Rowan’s NJ MAP research project puts powerful, easy-to-use answers within a few online clicks that can help protect every precious acre in the state.
The numbers tell a cautionary tale: During the past three decades, New Jersey builders converted 360,652 acres of farmland, forest and open space to housing, highways and shopping malls—the equivalent of 25.7 football fields of new urban growth every day since the 1980s.
For anyone concerned about open space, smart growth and unchecked development’s effects on everything from property taxes to supermarket parking spaces, access to this information is essential.
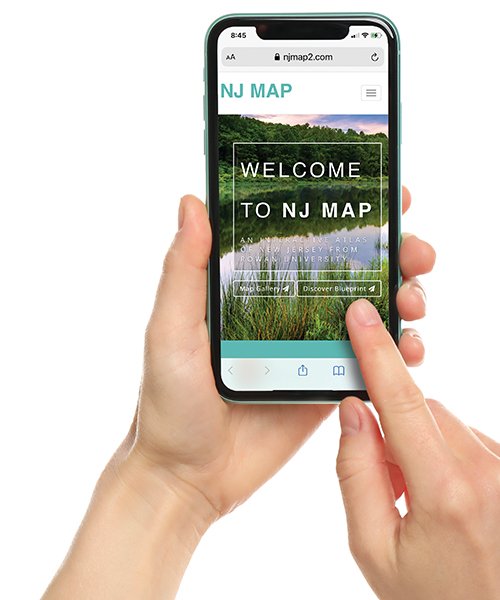
Based in Rowan’s Department of Geography, Planning & Sustainability, NJ MAP (njmap2.com) is an interactive collection of animated maps that gathers decades of state land-use data and illustrates the information to help residents, municipalities and environmental organizations see the big-picture changes around them. A long-term project involving Rowan faculty, students and staff, NJ MAP is helping to shape a shared vision for the state’s sustainability.
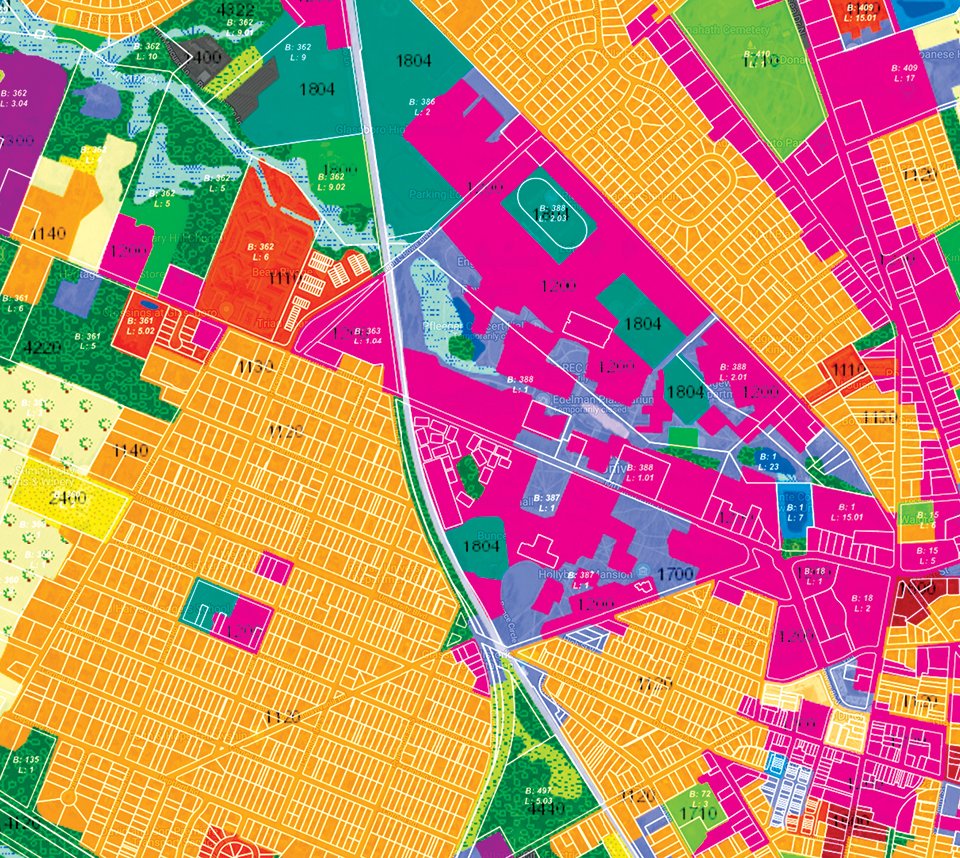
Land use in Glassboro
NJ MAP provides open access to hundreds of layers of information about the state. This map depicts land-use patterns for Rowan’s Glassboro campus and the surrounding neighborhoods. The project maps environmental changes that occur over time.
The numbers tell a cautionary tale: During the past three decades, New Jersey builders converted 360,652 acres of farmland, forest and open space to housing, highways and shopping malls—the equivalent of 25.7 football fields of new urban growth every day since the 1980s.For anyone concerned about open space, smart growth and unchecked development’s effects on everything from property taxes to supermarket parking spaces, access to this information is essential.
Based in Rowan’s Department of Geography, Planning & Sustainability, NJ MAP (njmap2.com) is an interactive collection of animated maps that gathers decades of state land-use data and illustrates the information to help residents, municipalities and environmental organizations see the big-picture changes around them. A long-term project involving Rowan faculty, students and staff, NJ MAP is helping to shape a shared vision for the state’s sustainability.
“When land becomes developed, there’s tension between creating desirable communities and minimizing environmental impact. The environment can handle development if it’s done properly,” said John Hasse ’95, geography professor and Geospatial Research Lab director. He started the mapping project in 2011 to track the state’s land-development patterns.
The project’s goal is to provide data and visual resources so residents can better understand land use and provide informed feedback about it to decision-makers.
NJ MAP offers multiple themes, including an animation of residential and commercial development in New Jersey from 1986-2015 (the last year for which statewide data are available); a section that prioritizes farmland for preservation; and a map that allows users to zoom in on individual parcels for detailed information such as the property’s location within a watershed.
Animated maps tell full story
Although much of the information on NJ MAP has been publicly available elsewhere, the data never have been provided in a visual way that puts it all in context, right at hand, Hasse said. “Presenting the information visually helps illustrate the past, the present and the future of development in New Jersey,” he said. “It’s especially vital for making decisions about land development in environmentally sensitive areas.”
For example, one map tracks the loss over time of thousands of acres of peach orchards in Gloucester County to development. Losing farmland largely to vast, often treeless housing tracts is, in some areas, erasing the bucolic nature of the region—the very thing that drew many to it in the first place.
“NJ MAP is communicating in a science-based way the changes that are happening in our backyards,” Hasse said. “If you can do that graphically, where people can zoom into their town, they can know more about where they live and be inspired to become more engaged in caring for their communities.”
More data, better decisions
Among the many social, cultural and economic effects of COVID-19 has been an upward pricing spiral of the national housing market. During the pandemic, the value of outdoor spaces for safe recreation skyrocketed, as did interest in telecommuting and other life-work changes that could benefit our environment.
On the other hand, the meteoric rise of e-commerce continues to fuel the shuttering of storefronts across the country. In New Jersey, warehousing is a growing concern with Amazon now the state’s largest employer, according to ROI-NJ. Though beneficial economically, it’s a troubling environmental trend to some residents and elected officials, including Senate President Stephen Sweeney.
“The rapid increase in the construction and operation of retail warehouses poses a threat to the preservation of farmland and open space,” Sweeney said.
In fact, NJ MAP’s data continues to be vital to the state’s farmland preservation program, the most successful in the nation by percentage of land protected.
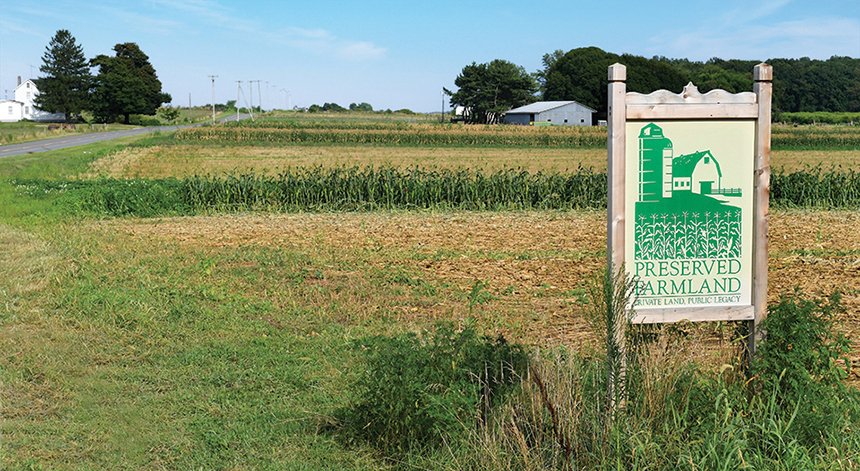
Farming future
New Jersey’s farmland preservation program is one of the nation’s most successful, with more than 2,700 parcels in permanent preservation. It uses NJ MAP Conservation Blueprint data extensively.
NJ MAP interfaces with other mapping-enabled websites such as the NJ Environmental Justice Mapping Tool (NJ DEP) and Zillow.
No matter the land-use focus for concerned individuals and organizations, NJ MAP data can be the first step in understanding limits and seeing options for planning sustainability. And becaus most land-use decisions are made locally, it’s vital that municipalities and planning boards have solid, robust data so they can make better decisions on land-use applications.
For residents, NJ MAP can provide information to help combat encroaching greenfield development—(construction on land that has never been developed)—and/or highlight favorable locations for redevelopment.The maps “can help towns, especially rural ones with smaller budgets, save money because they’ll have access to information for which they’d normally have to hire engineers or other professionals,”
said Katrina McCarthy ’09, lead project manager, who helps develop the maps.
With NJ MAP access on a smartphone or tablet, anyone who attends planning board meetings can view their neighborhood or a nearby waterway or other feature and ask informed questions, McCarthy said.
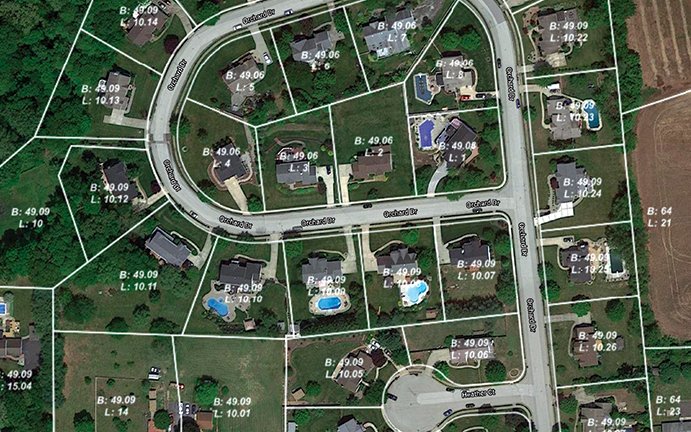
Property parcels
An essential layer for managing land use, regularly updated parcel information for the state’s 3.4 million properties is available at NJ MAP. Depicted here, a subdivision in Mullica Hill, Gloucester County, with lot and block numbers. Property parcels is NJ MAP’s most frequently visited map layer.
Blueprint provides guidance
A major part of the project is the New Jersey Conservation Blueprint, a partnership between Rowan’s GeoLab, the New Jersey chapter of the Nature Conservancy and the New Jersey Conservation Foundation. It uses a points system to prioritize areas for preservation as open space that could be used as parks or for other recreation. It also provides a visual ranking of land that is important to agriculture, ecological resources and water quality throughout the state.
Eric Olsen, director of the Land and Rivers Program for the New Jersey chapter of the Nature Conservancy, said the Conservation Blueprint has helped unite the state’s major environmental groups, which often can have varying agendas.
“It catalyzed the conservation community,” he said. “It created the impetus for us to begin developing a vision and to form answers to questions such as, ‘How do we continue to ensure that people in urban areas have access to parks and farmer’s markets?’ ”
In any community, NJ MAP data may be used to gather information, advocate for local improvements and prioritize projects. Camden’s project focus included information on food access, trails, transit, tree canopy cover and more that is helping city government, nonprofits and advocacy groups working to address decades of environmental injustice.Aided by NJ MAP, the Camden Conservation Blueprint, which launched in 2020, is a model for community planners, according to Hasse. It shows how the process can work to provide residents, community groups and planners with information to help improve health and quality of life. In Camden, the Hispanic Family Center and the New Jersey Tree Foundation collaborated to plant trees and promote community amenities like parks and playgrounds.
In 2021, collaboration continues, but with the Nature Conservancy and a focus on Newark, where the Newark Greenprint Project will launch this winter.
When the data hit home
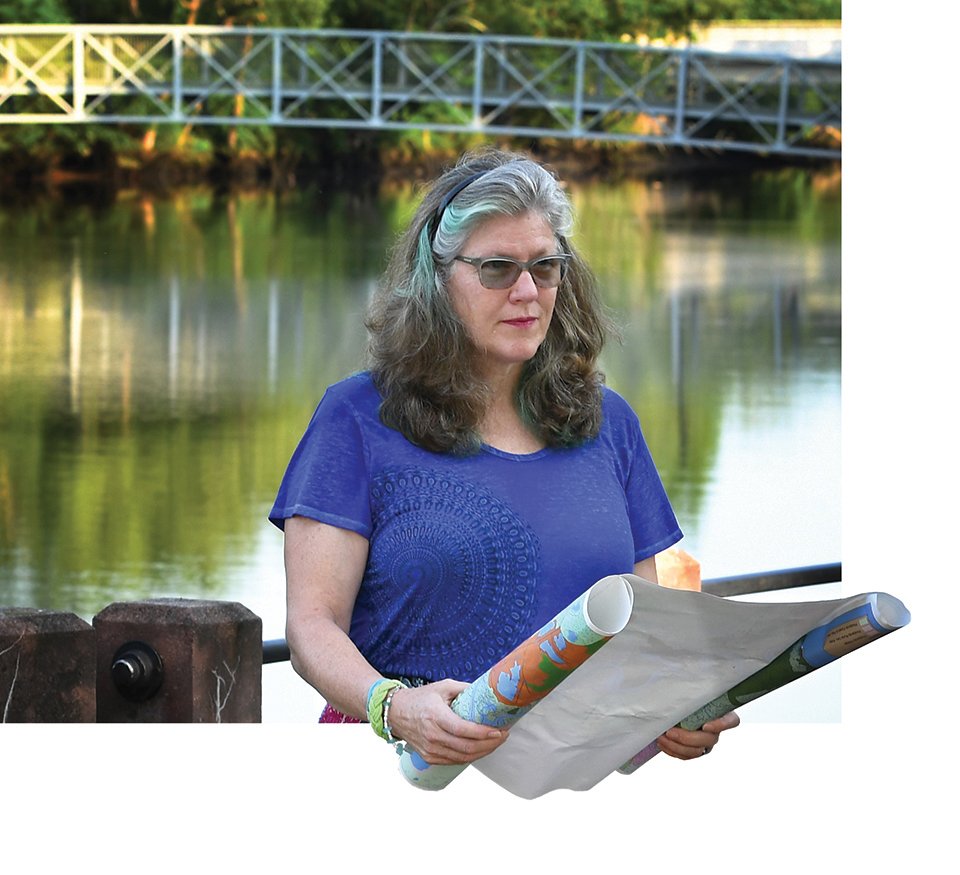
Meghan Wren ’19 has long fought the effects of climate change, even before it drove her family last year from their Bayshore home on Money Island in Downe Township.
The loss of their home, in large part due to rising bay waters, made the fight against climate change deeply personal, but she views NJ MAP as a resource to help
turn the tide.
“When someone can see their own house and where it is in the world, where floodplains are rising and how the community is changing, it empowers them and lets them engage in decisions for their place,” she said.
An area planner for the state of New Jersey, Wren believes humankind must use every available tool, such as NJ MAP, to identify and limit the effects of climate change before it’s too late.
“I remember hearing about climate change as something that might happen
in the future,” she said. “Well, it’s here now.”
Kudos and support
NJ MAP has been funded through public and private grants, including longstanding support from the Geraldine R. Dodge Foundation, as well as through state government contracts for creating specific environmental mapping. The financial investments demonstrate the significance of the Rowan team’s work and its relevance to New Jersey’s future.
Ironically, NJ MAP often attracts the attention of planners, organizations and public agencies across the U.S. who are interested in the Rowan team providing services for their projects, but Hasse has to turn them down. “It’s gratifying to know what we’re doing is considered so valuable that others seek our help,” Hasse said, “but our work is exclusive to our state and the NJ MAP platform.”
With that in-state focus, one of Hasse’s recent research collaborations documented New Jersey landscape changes in a 2020 report released with the Center for Remote Sensing & Spatial Analysis at Rutgers.
In the last three years, NJ MAP earned the support of the Garden State Preservation Trust and picked up two prestigious awards—NJDEP Governor’s Environmental Excellence Award (2019) and the N.J. chapter of American Planning Association Award for Community Engagement and Education (2020). New Jersey Monthly magazine featured the project in its January 2021 issue.
Plans for helping planners and teachers
Hasse said even as the Geospatial Research Lab seeks long-term project funding, it is working with K-12 and college teachers to create educational models to deploy NJ MAP in the classroom.
Meanwhile, the project continues to expand, he said, thanks to a small but skilled and dedicated staff that also includes Mark Corbalis, Mackenzie Franco ’16 and Michael Brein ’17. The group is working on animated climate maps, stormwater management illustrations and maps including key information for developing an environmental/natural resource inventory.
As it develops, the ultimate goal of NJ MAP is to transform the way New Jerseyans think about their home state. Development patterns that respect the Garden State’s environmental resources can result in sustainable smart-growth communities rather than unchecked suburban sprawl, Hasse said. “New Jersey’s land and waterways are precious. With the knowledge we share at NJ MAP, people gain the power to protect their neighborhoods and communities.
It’s power to make changes now and for the future.”
Tim Zatzariny Jr. ’94, M’07 teaches writing at Rowan. He lives in Woodbury, where he is the owner of On the Record, a record shop in the city’s downtown.
Steve Levine ’87, M’07 is a published novelist, award-winning former journalist, and serves as assistant director of Media & Public Relations for Rowan University.